How to Calculate Absenteeism (And Why the Formula Alone Isn’t Enough)
A practical guide to the absenteeism rate formula, industry benchmarks, and why modern teams rely on automated workforce systems rather than spreadsheets.
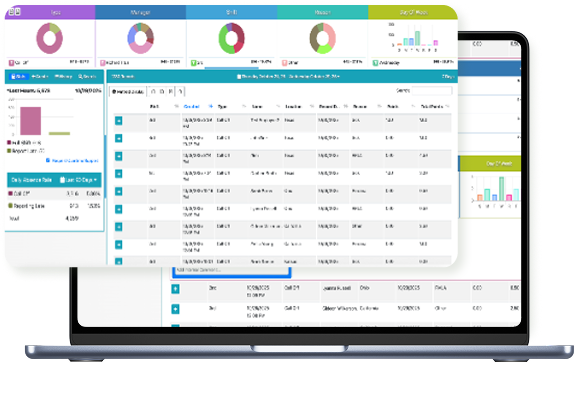
Want to move beyond spreadsheet tracking? See how PPWFM automates absenteeism tracking, policy enforcement, and real-time workforce visibility.
Schedule a 20-minute demo
Absenteeism is one of those workforce metrics that looks deceptively simple. Count missed days, divide by available workdays, and move on. In reality, absenteeism is a leading indicator of operational risk, labor cost leakage, compliance exposure, and productivity drag.
If you manage hourly workforces in manufacturing, logistics, healthcare, or education, knowing how to calculate absenteeism is table stakes. Knowing how to interpret it, act on it, and operationalize it is where organizations separate reactive reporting from proactive workforce management.
This guide breaks down the absenteeism calculation step by step, explains when and how to use it, and outlines why modern teams increasingly rely on automated workforce systems rather than spreadsheets.
What Is Absenteeism?
Absenteeism measures how often employees are unexpectedly absent from scheduled work. It typically excludes approved time off like vacations or planned leave and focuses on unscheduled absences that disrupt staffing plans.
High absenteeism is rarely just an attendance problem. It often correlates with:
- Increased overtime spend
- Missed production or delivery targets
- Manager burnout
- Compliance and policy enforcement challenges
That is why absenteeism is best treated as an operational metric, not an HR afterthought. Organizations that struggle with addressing excessive absenteeism often find the root cause is inconsistent tracking, not lack of effort.
The Absenteeism Rate Formula
The most commonly used absenteeism rate formula is:
Absenteeism Rate = (Total Unscheduled Absence Days ÷ Total Available Workdays) × 100
This produces a percentage that allows teams to compare absenteeism across time periods, departments, or locations.
Example Calculation
Assume:
- 50 employees
- Each scheduled for 20 workdays in a month
- Total available workdays = 1,000
- Total unscheduled absence days = 45
Absenteeism Rate = (45 ÷ 1,000) × 100 = 4.5%
On its own, 4.5% means very little. In context, it can mean everything.
What Counts as an Absence?
One of the most common mistakes organizations make is inconsistent definitions.
Most companies include:
- Call-offs
- No-shows
- Unplanned sick days
Most exclude:
- Approved PTO
- Scheduled vacation
- Jury duty
- Protected leave (FMLA, ADA accommodations)
The key is consistency. If departments track absences differently, the metric becomes unreliable and unusable for decision-making.
This is where standardized attendance tracking systems matter more than the math itself. Many organizations also benefit from implementing attendance point systems to create consistent, objective measurement.
How Often Should You Calculate Absenteeism?
There is no universal answer, but leading organizations follow a tiered approach:
- Daily: Real-time visibility for staffing decisions
- Weekly: Trend identification and short-term intervention
- Monthly: Performance benchmarking and cost analysis
- Quarterly: Policy review and workforce planning
Static monthly reports are increasingly insufficient for fast-moving operations. Absenteeism patterns emerge quickly, and delayed insight leads to delayed response.
What Is a “Good” Absenteeism Rate?
Context matters more than benchmarks, but general guidance looks like this:
| Rate | Assessment |
|---|---|
| 1–2% | Best-in-class, highly engaged workforce |
| 3–4% | Manageable but worth monitoring |
| 5%+ | Operational risk zone |
Healthcare, manufacturing, and logistics environments tend to experience higher baseline absenteeism due to physical demands and shift work. That does not make the impact any less costly. Understanding how to reduce no-call no-shows is often the first step toward lowering overall absenteeism rates.
Why Absenteeism Metrics Break Down in Practice
On paper, absenteeism calculation is simple. In practice, it breaks down for three reasons:
Manual tracking creates lag
By the time reports are compiled, the damage is already done.
Data lives in silos
Time clocks, spreadsheets, and manager notes rarely align.
No direct path to action
Metrics are reported, but not operationalized.
This is why absenteeism calculations alone rarely reduce absenteeism.
Turning Absenteeism Data Into Action
To be useful, absenteeism tracking must connect directly to:
- Attendance policies
- Point systems
- Progressive discipline
- Coverage planning
- Overtime controls
Modern workforce platforms automate this entire workflow. Instead of calculating absenteeism after the fact, these systems:
- Capture absences in real time via call-off hotlines or mobile tools
- Apply policy rules consistently
- Trigger alerts when thresholds are crossed
- Surface trends before they escalate
The result is fewer surprises and more control. For organizations looking to improve employee attendance management, the shift from reactive to proactive is where real results happen.
Ready to move from spreadsheet tracking to automated workforce management? See how PPWFM provides real-time absenteeism visibility and automated policy enforcement.
See a live walkthrough
Absenteeism by Industry
Different industries use the same formula but interpret it differently.
Manufacturing
Absenteeism directly impacts throughput, safety, and overtime budgets. Even a small spike can shut down a line or force premium labor costs. Learn more about manufacturing workforce solutions.
Logistics and Distribution
Absences cascade quickly into missed delivery windows and customer dissatisfaction. Explore logistics attendance solutions.
Healthcare
Coverage gaps create compliance risks and patient care issues. Absenteeism tracking must integrate tightly with staffing and credentialing. See healthcare workforce management.
Education
Absences affect continuity, substitute costs, and regulatory reporting. Learn about education attendance tracking.
In all cases, the formula is the same. The stakes are not.
Why Automation Matters More Than the Formula
Calculating absenteeism manually answers one question: What happened?
Automated systems answer a better one: What is about to happen?
Platforms like Productivity Pilot move absenteeism from static reporting to predictive management by:
- Standardizing absence definitions
- Enforcing policies automatically
- Providing real-time dashboards
- Reducing manager discretion and inconsistency
That shift is where organizations see measurable reductions — often up to 50% — in unplanned absences over time. The key is combining automated point tracking with workforce and shift management for end-to-end visibility.
Organizations considering attendance policy frameworks should also review no-fault attendance policy compliance to ensure their approach is legally sound.
Final Takeaway
Learning how to calculate absenteeism is essential. Relying on the calculation alone is insufficient.
High-performing organizations treat absenteeism as a controllable operational variable, not a passive HR statistic. They pair the formula with real-time data, automated enforcement, and proactive workforce planning.
If your absenteeism metric lives in a spreadsheet, you are measuring history. If it lives in an automated workforce platform, you are managing the future.